Introduction
Understanding the propagation of radio frequency (RF) energy in the presence of complex outdoor terrain features, such as in urban environments, is critical to the military’s planning, optimizing, and analyzing wireless communication and data networks. Unfortunately, simulating and visualizing RF energy propagation can be a difficult and time-consuming task: RF energy propagates throughout these environments via a combination of direct line-of-sight (LOS), reflection, and diffraction, all of which must be modeled accurately to obtain high-fidelity results. Moreover, features within the environment—trees, buildings, etc.—typically exhibit different permittivity and absorption properties with respect to the energy being measured and, therefore, also impact simulation fidelity. Finally, energy produced from a single transmitter may arrive at a given point in space from a variety of paths, each with a different length and, thus, with different time-delay characteristics.
Unfortunately, many of these tasks are difficult to accomplish with existing models. These models run slowly for moderate to large numbers of transmitter/receiver pairs, in part because they are not designed to take advantage of modern multicore computer architectures. Moreover, these models do not account for noise caused by multipath scatter but instead use unacceptably large estimates for its effects. As a result, many organizations lack the tools required to execute rapid visual analysis of network operations involving RF propagation within the time limits or data quality required to satisfy their requirements.
One promising solution for these challenges is StingRay, an interactive environment for combined RF simulation and visualization based on ray tracing (Figure 1). StingRay is explicitly designed to support high-performance, high-fidelity simulation and visualization of RF energy propagation in complex urban environments by exploiting modern multicore computer architectures, particularly Intel’s Xeon processor family. High-performance RF simulation is achieved with Intel’s Embree ray tracing kernels [1], and Intel’s OSPRay rendering engine [2] provides high-fidelity visualization of the resulting data. The combined simulation and visualization approach allows analysts to interactively configure all aspects of the simulation scenario, including the underlying physical environment (Figure 1, top) and visualizations of the resulting data (Figure 1, middle and bottom), providing the flexibility to quickly identify the propagation phenomena of interest and ultimately reduce time-to-insight.

Figure 1: High-Performance RF Model Using Ray Tracing.
Optical, or Whitted-style, ray tracing [3] simulates the propagation of visible light in complex three-dimensional (3-D) environments and elegantly handles dominant visual phenomena such as reflection, refraction, and shadows (Figure 2). RF energy is also a form of electromagnetic energy (albeit at a highly different frequency than visible light); thus, ray tracing offers a possible approach for simulating physical phenomena in the RF domain. We build on state-of-the-art optical ray tracing techniques to simulate RF energy propagation, or so-called radio frequency ray tracing (RFRT), in complex urban environments.
Figure 2: Ray Tracing for Light Transport Simulation. (Turner Whitted)
Is High-Performance Computing for You?
If you are interested in faster times to solution, improved analysis, sounder decision support, higher-quality products, and increased organizational productivity, then the answer is “yes!” What’s more, once potential users discover that the supercomputing resources needed to achieve these benefits are available to Department of Defense (DoD) users free of charge, the answer often is “absolutely yes!”
High-performance computing (HPC) enables sophisticated and increasingly realistic modeling, simulation, and data analysis that can profoundly advance theoretical knowledge and expand the realm of discovery, thereby generating leading edge research and development. The massive processing power and data storage capabilities of HPC also make it possible to conduct experiments that are otherwise impossible or impractical to execute and permit the analysis of extremely large datasets that were previously intractable.
For example, consider the assessment of hypersonic air vehicle concepts. Once modeled in an HPC system, air flow points can now be examined under conditions that are impossible to measure in a wind tunnel or that are physically unachievable on a test range. And this is just one example; the possibilities are endless. Ultimately, the question to ask is “Does supercomputing provide the means to obtain better or added information that would help the United States make better-quality decisions and develop superior products for our Warfighters?” Once again, the answer is “yes!”
While some Defense organizations can execute software codes on slower, less capable, workstations and computer clusters, these organizations are often unable or unwilling (due to time constraints) to run new, complex problems at higher resolution that can lead to further breakthroughs and better tools for future generations. In short, these organizations may be unnecessarily compromising future value for the sake of time. Still other organizations fear high HPC startup costs without fully appreciating the colossal benefit reaped after the initial technical investment.
Furthermore, many U.S. competitors and adversaries clearly understand the HPC return-on-investment and are aggressively pursuing supercomputing as a way to gain a competitive advantage. Thus, more than ever, the DoD needs to outcompete its foes to maintain the U.S. technological edge. Just getting the job done is no longer sufficient; organizations must evolve to support the establishment of an advanced computational foundation for future generations.
Because of these concerns, the DoD High Performance Computing Modernization Program (HPCMP) was established by Congress to provide DoD-funded HPC capabilities, subject-matter expertise, and technical assistance to help DoD scientists and engineers to leverage HPC in their work. The DoD HPCMP develops and fields massively parallel, state-of-the-art supercomputers and storage systems at five DoD Supercomputing Resource Centers (DSRCs) located across the nation. The program supports both classified and unclassified computing capability that can be accessed remotely.
In addition, the HPCMP also manages the Defense Research and Engineering Network (DREN), providing high-bandwidth, low-latency connectivity among DoD Research, Development, Test & Evaluation (RDT&E) sites, academia, research laboratories, and the DSRCs. Most importantly, the DoD HPCMP also provides help desk support and subject-matter experts in 11 computational areas to facilitate transition and execution of codes onto DoD supercomputing systems and provides licenses for the most predominant scientific and engineering software packages. And once again, all of these services and capabilities are funded and provided to DoD HPCMP users at no cost.
If you are interested in further information on how to access DoD HPC and the aforementioned resources, please contact the DoD HPC Help Desk at 877.222.2039. Additional information may also be found at http://www.hpc.mil
RFRT offers several advantages over traditional RF simulation methods. First, modifications to an optical ray tracer that are necessary to capture important physical phenomena, such as diffraction and interference, are fairly straightforward. Second, RFRT generates the full signal trajectory, allowing computation and visualization of signal characteristics that are extremely costly, or even impossible, with other methods. Finally, RFRT scales effectively, both with geometric complexity and with processor count. These characteristics, combined with nearly 35 years of research in high-performance optical ray tracing techniques [4], make ray tracing an ideal method on which to base a highly interactive combined RF simulation and visualization tool for understanding RF propagation phenomena.
In succeeding text, we discuss the key components of our combined RFRT simulation and visualization approach, we examine simulation performance on a workstation-class desktop computer, and we show several visualizations highlighting the advantages of an interactive environment for understanding RF energy propagation.
RF Ray Tracing
Ray-based methods have been used to approximate the solution of wave equations for electromagnetic fields in nondissipative media for at least four decades [5, 6]. Typically, these methods proceed in two steps. First, ray paths connecting source and receiver are found; in complex environments, this step is often the most time-consuming. Second, the wave equation is applied to compute field transport along identified ray paths. Classical ray-based approaches that operate in this manner typically require many hours of run time to simulate areas out to 1 km or more.
In contrast, our approach to RF modeling uses ray tracing techniques from computer graphics [3, 7]. Simulations in the optical domain model the scattering of ordinary incoherent light, and the effects of multiple rays are combined by adding powers of individual rays. This approach can also be used to predict the small area average received power and the fast fading statistics of signals in the RF domain. Moreover, our ray-based approach can easily incorporate phenomena such LOS transmission; multipath effects from specular reflection, diffraction, and diffuse scattering; and environmental conditions such as fog and rain.
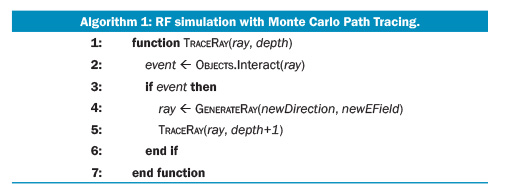
In particular, Monte Carlo path tracing [7] formulates a solution to the wave equations for electromagnetic fields using a geometric optics approximation that models interesting visual phenomena. Path tracing probabilistically selects just one path of a (possibly) branching tree at each ray/object interaction. This approach drastically reduces the number of ray/object interactions that must be computed, thereby improving computational efficiency. We adapt the path tracing algorithm (see Algorithm 1) to compute energy propagation characteristics, including those arising from wave-based phenomena, in the RF domain.
Algorithm 1: RF simulation with Monte Carlo Path Tracing.
Together with our collaborators at the University of Utah, we previously developed the Manta-RF radio frequency ray tracing system [8, 9, 10]. As in classical ray-based techniques, Manta-RF uses the ray concept; however, transport properties are computed directly by launching many rays—on the order of 108 to 1011 or more—and using the statistical properties of ray distribution and density to represent received power. Whereas classical rays are defined by the order and location of their interactions with environmental features, rays in Manta-RF are more appropriately described as RF photons—discrete packets of electromagnetic energy in the RF portion of the spectrum. Validation against several measured datasets shows that a Monte Carlo approach to ray-based RF simulation offers high-fidelity results comparable to those produced by classical ray-based methods (Figure 3). StingRay builds on the ray-based RF simulation techniques developed for Manta-RF but leverages recent advances in ray tracing [1] and visualization [2] application programming interfaces (APIs) to provide a fully interactive combined RF simulation and visualization environment.
Figure 3: High-Fidelity RF Simulation via Monte Carlo Path Tracing, Comparing Signal Loss Predictions Using RFRT and VPL [11] (left) Against Measured Data from Rosslyn, VA (right). (Data and image courtesy of Konstantin Shkurko, University of Utah)
StingRay
Combined simulation and visualization of various physical phenomena, including RF energy propagation, promotes deeper understanding of these phenomena, thereby reducing time-to-insight for mission planning tasks. However, the complexity of typical RF analysis scenarios, including the underlying physical environment and the sheer number of ray/object interactions, can lead to issues with scale and visual clutter. Such issues necessitate a flexible, interactive environment in which analysts control both inputs and results at run time.
StingRay satisfies these constraints via an extensible, loosely coupled plug-in architecture. The simulation and visualization components promote flexibility with user-controlled features, while an extensible graphical user interface (GUI) enhances a user’s ability to perform debugging and analysis tasks by enabling easier navigation and exploration of the data in real-time.
System Architecture
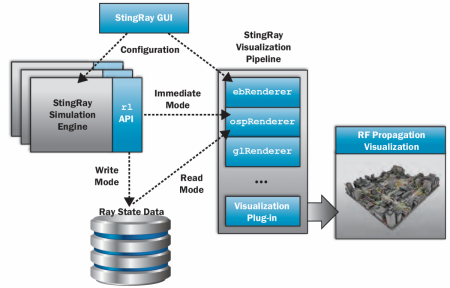
The key components of the StingRay system architecture (Figure 4) combine to form an analysis process that is functional, flexible, and extensible. The design of StingRay leverages the following concepts:
Figure 4: StingRay System Architecture.
- Plug-In Architecture. StingRay is built around a set of configurable components that follow a specific design pattern to create a flexible infrastructure in which to implement RF simulation and visualization. We provide a set of core components to perform common tasks, but the plug-in architecture enables a programmer to create new components and extend the core facilities with arbitrary functionality.
- Pipelined Rendering. StingRay uses a pipeline model for rendering, coupled with lazy evaluation for necessary values to avoid recomputation in later stages. The pipeline model leads to a layered visualization approach in which results of individual components are combined, under control of the user and at run time, to achieve the desired result.
- Extensible GUI. The simulation and visualization components are integrated via an extensible GUI to enable comprehensive control of the entire analysis process. These components can tailor their user interface, exposing input parameters in a manner consistent with the functionality they provide. These features provide fine-grained control of the entire analysis process, making StingRay ideally suited to a wide variety of mission planning tasks.
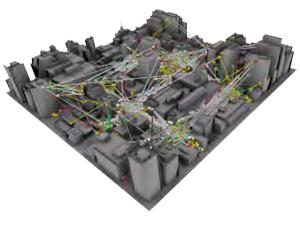
As shown in Figure 5, this design enables layered visualization within the spatial domain of computation by compositing visual elements from several components to generate the final image. Here, glyphs depicting ray paths are composited with a rendering of the simulation domain, providing insight into the dominant energy transport paths in this environment.
Figure 5: StingRay’s Layered Visualization.
Simulation Engine
As noted previously, our approach to RF modeling builds on ray tracing techniques from computer graphics [3, 7]. Optical ray tracing computes light transport paths recursively from sensor to source to capture important visual phenomena, and therefore provides a possible approach for simulating various phenomena in the RF domain. However, to do so accurately, the basic algorithm must be modified to handle two particular phenomena important to RF energy propagation: diffraction and interference.
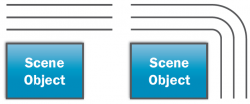
Diffraction describes the apparent bending of waves around small obstacles and the spreading of waves past small openings (Figure 6[a]). Diffraction effects are generally most pronounced for waves with wavelengths similar in size to the diffracting object. For visible light, and thus for optical ray tracing, diffraction is typically ignored because its effects are vanishingly small at normal scales. However, for RF simulation, effects from diffraction can be significant; accuracy thus dictates that we model these effects. Specifically, StingRay captures so-called edge diffraction, in which obstacles act as a secondary source and create new wavefronts.
To model edge diffraction, we first determine when rays are near edges that cause diffraction. We accelerate this process by computing and storing proxy geometry for all the possible diffraction edges (ignoring concave and flat edges) as an offline preprocessing step. Then, during simulation, when a ray interacts with diffraction edge proxy geometry (Algorithm 1, line 3), the incident ray is terminated, and a diffraction ray is generated according to the Geometrical Theory of Diffraction [12], as described by Moser et al. [13] and traced through the scene.
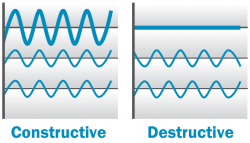
Interference refers to the phenomena in which two waves superimpose to form a resultant wave of greater or lesser amplitude (Figure 6(b)). As with diffraction, the impact of interference is typically ignored in optical ray tracing, as the effects are too subtle to detect at typical scales. Similarly, however, in RF simulation, interference can have a significant impact on the perceived energy at a receiver, and accuracy again dictates that we model interference effects.
To model interference, we simply account for the phase of the wave represented by each ray and use phasor addition when accumulating energy at the receivers (Algorithm 1, line 2).
Figure 6a: Diffraction in Ray-Based RF Simulation.
Figure 6b: Interference in Ray-Based RFSimulation. (Original version: Haade via Wikimedia Commons)
The StingRay RF simulation engine implements the key RF propagation phenomena using a collection of C++ objects, including:
- Scene Geometry
- Diffraction Edge Proxy Geometry
- Ray Path Loggers.
The simulation functionality is exposed to client applications through a multi-threaded controller object that provides a straightforward API.
At its core, the simulation engine invokes Embree to efficiently trace rays through the physical environment defined by the scene geometry. The actions following a ray/object intersection are determined by the type of object intersected (Algorithm 1, lines 2–7). For example, a sensor sphere simply accumulates ray power and terminates traversal, whereas scene or proxy geometry generates a simulation event that encapsulates information about the ray/object interaction, including the object’s material properties. These properties define how a ray interacts with the intersected object, and may result in recursive traversal of new rays to capture specular reflection or diffraction.
Performance
We achieve high-performance RF simulation using Embree to compute ray/object intersections quickly and efficiently. Embree implements a highly optimized ray tracing engine for Intel Xeon family processors, including Xeon Phi coprocessors. To accelerate ray traversal, Embree employs numerous algorithmic and code optimizations, as determined by application characteristics and the underlying processor architecture. Embree provides state-of-the-art ray tracing capabilities for applications across a variety of optical and nonoptical simulation domains.
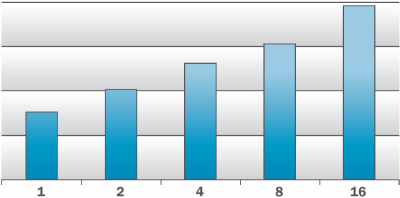
Importantly, ray-based simulation techniques—including RFRT—belong to a class of problems considered to be embarrassingly parallel; that is, each unit of work is independent of every other unit. In RFRT, the rays composing one path are completely independent of the rays composing every other path, and can be processed independently on separate processors. Thus, simulation performance scales well with processor count (Figure 7), allowing tradeoffs between performance and fidelity based on the number of available processors.
Figure 7: Simulation Performance as a Function of Processor Count, Allowing the Balancing of Performance and Fidelity Based on the Number of Available Processors.
Visualization
As noted previously, we adopt a layered visualization approach in which elements from separate visualization components are composited to generate the final image. StingRay currently supports several visual elements for RF visualization:
- Underlying Scene Geometry
- Diffraction Edge Proxy Geometry
- Ray Glyphs.
StingRay also supports visualization of scalar volume data generated from simulation results: client applications can configure the engine to capture detailed information regarding the full path generated for each transmitter sample. These data allow computation and visualization of signal characteristics that are extremely costly, or even impossible, with other RF simulation methods. For example, RF energy characteristics at arbitrary locations in the environment can be visualized by collecting ray paths during simulation, converting the data to a scalar volumetric representation, and rendering the resulting data using traditional volume rendering techniques or as participating media (Figure 8).
Figure 8: Scalar Volume Data Generated From RF Simulation Results.
Conclusions and Future Work
RF simulation and visualization are critical to planning, analyzing, and optimizing wireless communication and data networks. An interactive tool supporting visual analysis of RF propagation characteristics in complex environments enables analysts to better understand RF propagation phenomena in a timely manner. StingRay provides an interactive combined RF simulation and visualization environment that satisfies these constraints. The tool combines the best-known methods in high-performance ray tracing and visualization with low-level, architecture-specific optimizations for modern multicore processor architectures, thereby enabling a highly interactive environment for predictive simulation and visualization of RF energy propagation in complex environments.
StingRay implements a novel RFRT methodology based on Monte Carlo path tracing. This approach probabilistically selects just one path of a (possibly) branching tree at each ray/object interaction, which drastically reduces the number of ray/object interactions that must be computed and, ultimately, improves computational efficiency. Additional efficiency improvements could be gained by leveraging more sophisticated ray tracing algorithms from the computer graphics literature.
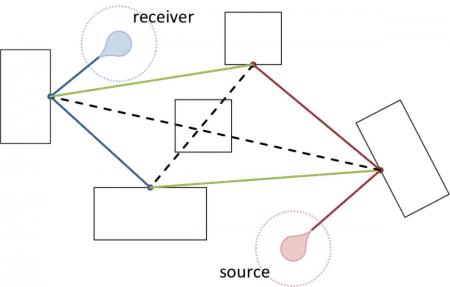
For example, bidirectional path tracing (BDPT) is a Monte Carlo ray tracing algorithm that generalizes the classical path tracing algorithm (Figure 9). Paths originating from both source (red) and receiver (blue) are first computed using the classic algorithm; path vertices are then connected using occlusion rays (green, black), and energy is accumulated at the receiver for unoccluded paths (red+green+blue). Results show that BDPT performs better than classical path tracing for environments in which indirect (non-LOS) contributions are most significant. We would like to investigate the application of BDPT to RF simulation to further improve the performance and accuracy of StingRay.
Figure 9: Bidirectional Path Tracing for Improved Computational Efficiency.
Acknowledgments:
The authors gratefully acknowledge the contributions of the Intel Parallel Visualization Engineering Team, including Jim Jeffers, Ingo Wald, Carsten Benthin, Greg P. Johnson, Greg S. Johnson, Brad Rathke, and Sven Woop. We also thank Erik Brunvand, Thiago Ize, and Konstantin Shkurko of the University of Utah, Lee Butler of the U.S. Army Research Laboratory, and Henry Bertoni of NYU Polytechnic for their contributions to the early research, development, and reporting efforts that led to the RF simulation methodology on which StingRay is based.
References:
- Wald, I., S. Woop, C. Benthin, G. S. Johnson, and M. Ernst. “ Embree—A Kernel Framework for Efficient CPU Ray Tracing. ACM Transactions on Graphics, vol. 33, no. 4 (July), pp. 143:1—143:8, 2014.
- Intel Coporation. “OSPRay: A Ray Tracing Based Rendering Engine for High-Fidelity Visualization.” Available at http://ospray.github.io. Last accessed 12 December 2014.
- Whitted, T. “An Improved Illumination Model for Shaded Display.” Communications of the ACM, vol. 23, no. 6, pp. 343–349, 1980.
- Keller, A., I. Wald, T. Karras, S. Laine, J. Bikker, C. Gribble, W.-J. Lee, and J. McCombe. “Ray Tracing Is the Future and Ever Will Be.” ACM SIGGRAPH 2013 Courses, 2013.
- Deschamps, G. A. “Ray Techniques in Electromagnetics.” Proceedings of IEEE, vol. 60, no. 9, pp. 1022–1035, 1972.
- Felsen, L. B. and N. Marcuvitz. Radiation and Scattering of Waves. Prentice Hall, Englewood Cliffs, NJ, 1973.
- Kajiya, J. T. “The Rendering Equation.” In SIGGRAPH ’86: Proceedings of the 13th Annual Conference on Computer Graphics and Interactive Techniques,” pp. 143–150, 1986.
- Shkurko, K., T. Ize, C. Gribble, E. Brunvand, and L. A. Butler. “Simulating Radio Frequency Propagation via Ray Tracing.” Poster, GPU Technology Conference 2013. Available at http://www.gputechconf.com/page/posters.html. Last accessed 3 April 2013.
- Brunvand, E., T. Ize, and E. Ribble. “Ray Trace Applications to Radio Frequency (RF) Propagation.” Final report, U.S. Army Research Office, Contract No. W911NV-07-D-0001, TCN 09-063, 2009.
- Brunvand, E., and T. Ize. “Radio frequency (RF) Ray Trace Propagation Analysis.” Final report, U.S. Army Research Office, Contract No. W911NF-07-D-001, TCN 10-218, 2011.
- Liang, G., and H. L. Bertoni. “A New Approach to 3D Ray Tracing for Site-Specific Propagation Modeling.” IEEE Vehicular Technology Conference, pp. 853–863, 1997.
- Keller, J. “Geometrical Theory of Diffraction.” Journal of the Optical Society of America, vol. 52, no. 6, pp. 116–130, 1962.
- Moser, S., F. Kargl, and A. Keller. “Interactive Realistic Simulation of Wireless Networks.” IEEE Symposium on Interactive Ray Tracing, pp. 161–166. 2007.




![Figure 3: High-Fidelity RF Simulation via Monte Carlo Path Tracing, Comparing Signal Loss Predictions Using RFRT and VPL [11] (left) Against Measured Data from Rosslyn, VA (right). (Data and image courtesy of Konstantin Shkurko, University of Utah) Figure 3: High-Fidelity RF Simulation via Monte Carlo Path Tracing, Comparing Signal Loss Predictions Using RFRT and VPL [11] (left) Against Measured Data from Rosslyn, VA (right). (Data and image courtesy of Konstantin Shkurko, University of Utah)](/wp-content/uploads/2019/11/p19-700x271.png)
