Introduction
Although the word “metrology” may be unfamiliar to many in the world of military equipment design and testing, it is a word becoming increasingly important. Metrology can be defined as the science of measurement in support of engineering. And rapid advances in technology and computing power have brought about an abundance of new metrology equipment and techniques that are being employed to make various phases of military equipment testing—including test planning, test execution, and test evaluation—significantly more efficient and accurate.
This article provides an overview of the categories of basic metrology equipment currently available and gives an example of specific commercial versions of these tools that would typically be found in the inventory of a well-equipped metrology company. Also included are several examples of military testing and modeling projects in which some of these innovative tools and techniques have been employed to streamline and improve the results. These projects include:
- Arena testing for the dispersion of fragmentation and collateral damage on the detonation of a missile or warhead.
- Analyses of buried blast craters for battlefield forensics and the verification and validation of predictive models.
- Three-dimensional (3-D) modeling of Mine Resistant Ambush Protected (MRAP) Cougar vehicle variants for space claim and testing purposes.
Digital Metrology
Traditionally, when models are created for test support, analog measurements tools—such as tapes, plumb bobs, and calipers—are employed. But these tools and techniques have their limitations. Such data collection is slower and is largely dependent on the skill of the person conducting the measurements. Additionally, for large vehicles or parts, measurement errors tend to stack up, leading to undesirable inaccuracies. And as the readings are logged manually, they may also be susceptible to transcription errors.
On the other hand, digital metrology methods are usually much faster and less susceptible to the measurer’s personal measurement biases. Further, the accurate framework produced by digital technologies allows for manual measurements to be included as necessary, but without the disadvantage of excessive measurement uncertainty buildup.
Digital metrology supports many engineering applications, such as:
- Reverse Engineering – This application of digital metrology is used when a set of blueprints, or more commonly a 3-D computer model, is constructed from an actual part or vehicle for which no blueprints exist, or where blueprints do exist but are inaccurate, outdated, or not available (see examples in Figure 1).
- Rapid Protoyping – This area takes reverse engineering a step further to create a prototype, often by modifying measurements of an existing part. Generally, a full-size prototype is created using additive (3-D printing) or subtractive (computer numerical control [CNC]) manufacturing techniques to check for fit, form, and function before production commences.
- Checking Parts and Surfaces Against a Blueprint or Computer Model – This activity ensures that parts meet certain geometric requirements, usually defined, unambiguously, by geometric dimensioning and tolerancing (GD&T).

Figure 1: From Physical Part to Digital Model. (Photographs and models courtesy of SURVICE Engineering.)
Metrology in support of testing is always in some form of geometric modeling and sometimes includes reverse engineering, as described later in the MRAP Cougar modeling discussion.
Metrology Equipment
While a large selection of metrology tools are currently available, newer, more portable, hi-tech tools are continuously being released into the marketplace. Because of the nature of modeling for test support, portable measurement solutions are generally favored over fixed solutions, as portable measurement devices can be brought directly to the test area, part, or vehicle. Thus, while large, fixed devices, such as coordinate measurement machines (CMMs), are also used extensively to support military testing, the discussion here is limited primarily to portable equipment. One notable exception to this limitation, however, is computed tomography (CT) scanners, which are also included in the discussion of noncontact measuring devices because of their particular suitability to inspecting internal damage of test items such as body armor or helmets.
The following is a brief overview of current portable metrology equipment and some of its unique capabilities.
Portable metrology equipment can be broadly divided into the following two categories:
- Contact Devices – Portable CMMs are easily transportable versions of the fixed CMMs that provide high-accuracy (often <0.001 inch) quality control in large manufacturing facilities. The accuracy of portable CMMs is >0.001 inch due to their portable nature and also because they are seldomly used in the climate-controlled environment that is generally required for fixed CMMs. Examples of portable CMMs are laser trackers and mechanical measurement arms. They are most often used for point-to-point measurements.
- Noncontact Devices – 3-D, noncontact scanners can rapidly collect clouds of many thousands of data points. They often are divided into several categories depending on their type of data capture process. Typical accuracies range from 0.001 inch to >0.050 inch.
Also common are hybrid devices that combine a noncontact scanner with a portable CMM so that the position and orientation of the scanner is known, thus referencing the point cloud to a global reference coordinate system. The most common of these hybrid devices are measurement arms combined with a triangulation-type laser scanner.
Contact Devices
Contact measurement devices are suited to many aspects of test support because of their portability, accuracy, and ability to operate outdoors when required. These devices are illustrated in Figure 2, with the most common contact devices being mechanical measurement arms and laser trackers.
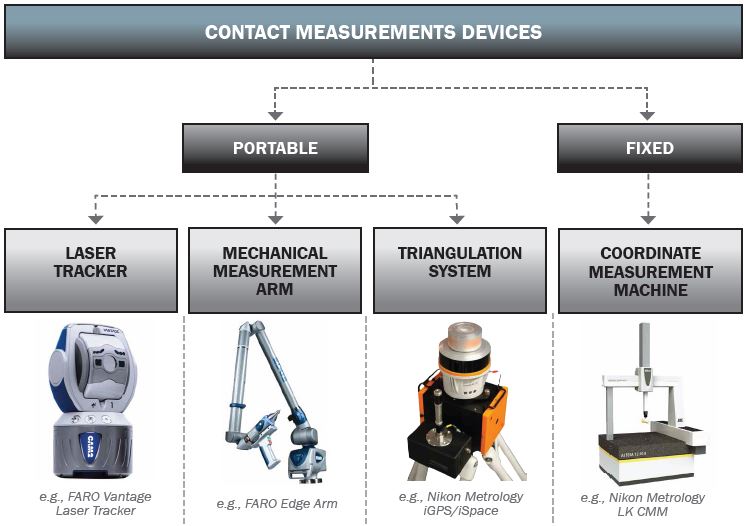
Figure 2: Contact Measurement Devices.
The articulated measurement arms allow multiple degrees of freedom as the operator collects individual points or streams of points using a trigger-operated point probe. A laser tracker operates by centering a laser beam on and measuring two gimbal angles and a distance to a retroreflector target. The distance is generally measured using a time-of-flight technique known as absolute distance measurement. For the highest accuracy work, not generally applicable to modeling for test support, distance measurement interferometery may be used. The position of the retroreflector (and hence the part or vehicle surface) is then calculated from the two angles and a distance. As with articulated arms, measurements are triggered by the operator and are either individual points or streams of points a fixed distance or timing interval apart.
The less common intelligent GPS (iGPS) is a unique portable contact measurement device in which the position of a vector bar is determined by triangulating from multiple transmitters. The transmitters emit laser light and light pulses that the sensors in the vector bar convert to relative azimuth and elevation. A hand-held vector bar, which is equipped with dual sensors, is used to calibrate the system and define the global coordinate system. The iGPS system is capable of providing coordinates in the global coordinate system to an accuracy of approximately 0.004 inch.
The advantages of contact devices include their high accuracy, ability to measure into slots and pockets sometimes with appropriate tooling, and insensitivity to the color or transparency of the part being measured. However, these advantages are partially offset by the slow data collection rate and possible distortion of soft objects when in contact with the probe or the retroreflector.
Table 1 provides the basic specifications for some typical commercial contact measurement devices.
| Technology | Company | Model | Volume | Specified Accuracy |
|---|---|---|---|---|
| Mechanical measurement arm with point probe | FARO Technologies, Inc. | FaroArm Edge | 8 ft to 12 ft per setup. Much larger volume with rapidly reduced accuracy with multiple instrument setups using reference points | 0.001 inch at 8 ft |
| Laser tracker | FARO Technologies, Inc. | Laser Tracker Vantage | Typically 40 ft per setup. Much larger volume with slightly reduced accuracy with multiple instrument setups using reference points | 0.001 inch at 6 ft
0.002 inch at 20 ft |
| Triangulation | Nikon Metrology | iGPS | Unlimited depending on number of transmitters | From 0.004 inch |
Noncontact Devices
Noncontact scanners project a laser or light pattern onto the part and then observe either the transmitted or reflected energy. A point cloud representative of the geometry of the part is calculated by means of triangulation, time-of-flight, or wave interference information. There are many methods to classify noncontact data collection devices. One of the most common is illustrated in Figure 3.
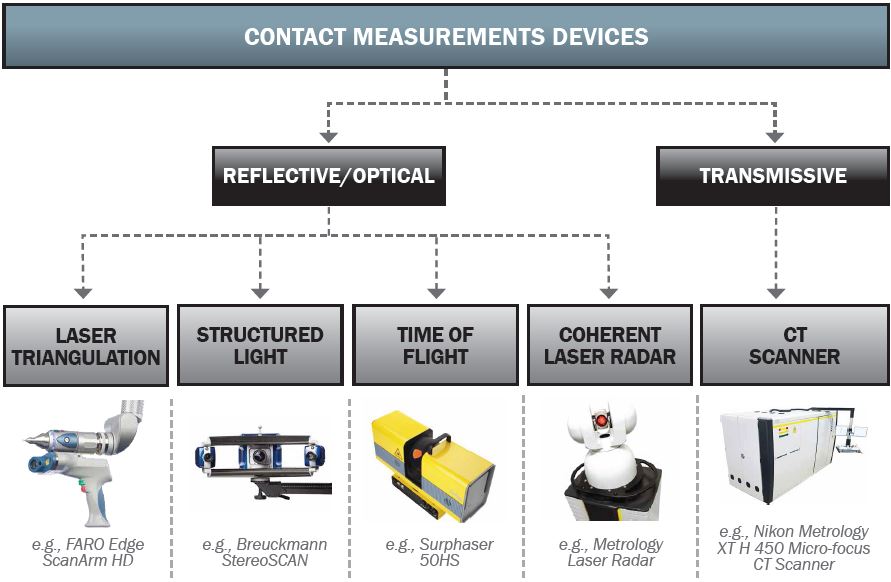
Figure 3: Classification of Noncontact Measurement Devices.
Noncontact measurement devices are typically fast, provide good accuracy, and deliver large quantities of data. Optionally, they can sometimes collect object color texture information and can often scan detailed information that may be too small to be measured using a touch probe or laser tracker target. However, noncontact measurement devices may have difficulty with dark or reflective surfaces and with surfaces that are transparent or semi-translucent, such as composite materials.
Table 2 provides the basic specifications for some typical commercial noncontact measurement devices.
| Technology | Company | Model | Volume | Specified Speed/Accuracy | |
|---|---|---|---|---|---|
| Mechanical measurement arm hybrid | FARO Technologies, Inc. | Faro Edge ScanArm HD | 8 ft to 12 ft per setup. Much larger volume with reduced accuracy with multiple instrument setup using reference points | 500,000 points per second/from ±0.001 inch | |
| Structured light | Aicon 3D Systems GmbH | StereoSCAN HE (blue light/white light) | Field of view up to 2.5 ft × 2.5 ft × 1.8 inch | 16 MB per measurement (0.1 s)/from ±0.005 inch | |
| Structured light | Mantis Vision, Ltd. | Mantis Vision F5 (infrared) | Range 1.5 ft to 15 ft | Up to 50,000 points per frame and 10 frames per second/from 0.2 inch | |
| Time of flight (phase shift) | Basis Software | Surphaser 50HS | Range 5 ft to 300 ft | Up to 1,000,000 points per second/from 0.026 inch at 30 ft | |
| Coherent laser radar | Nikon Metrology | MV350 | Range 3 ft to 150 ft | Up to 4,000 points per second/from 0.004 inch at 30 ft | |
| X-ray computed tomography | Nikon Metrology | XT H 450 | Measurement volume for single measurement: 16 inch × 24 inch × 24 inch | Several hours for measurement/from 0.001 inch | |
Triangulation Techniques
Most laser scanners use triangulation to determine the location of points on the surface of a part. As shown in the simplified triangulation scheme in Figure 4, a laser beam is projected onto the surface of the part, and the location of this beam on the sensor, together with the known distance between the beam and sensor, is used to calculate points on the surface of the part. Laser triangulation systems may be self-contained and even hand-held for certain models and may also be mounted, in addition to or instead of a point probe, on the end of a mechanical measurement arm.
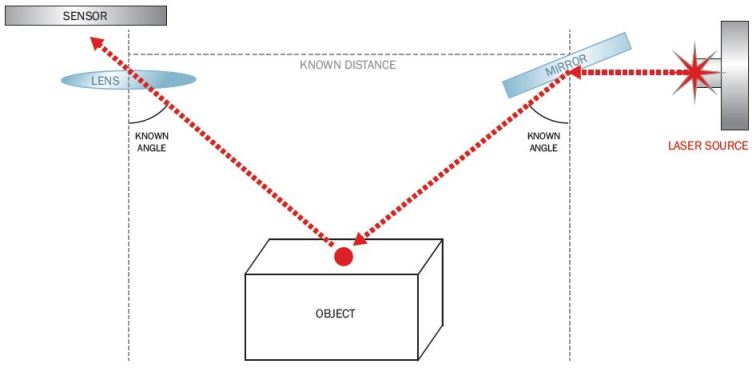
Figure 4: A Simple Laser Scanner Triangulation Configuration.
Structured Light
In structured light scanning, a visible or infrared light pattern is projected onto the part, and an image of the reflected pattern is captured on a sensor. The image, which is distorted by the contours of the part, is processed to calculate coordinates of points on the surface of the part. Structured light scanners may use various colors of light—blue is an especially popular one—which provide advantages depending on the color of the surface being measured. However, white light remains a good compromise when objects of various colors are to be measured. Additionally, structured light scanners are capable of rapid data collection and can collect either black and white or color texture information.
Time-of-flight (TOF) Scanners
TOF scanners effectively measure the time that a generated light pulse takes to travel to an object, bounce off of it, and return to a receiver. The distance from the scanner to the part may be calculated using the known speed of light. In practice, phase-shifting is often used in place of direct measurement of time, which also allows for a single line of sight rather than a discreet transmitter and receiver a set distance apart. TOF scanners provide an object’s geometry but not its texture. These scanners are fast, suitable for the measurement of objects larger than 10 ft, and capable of medium accuracy (from about 0.02 inch).
Coherent Laser Radar (CLR)
CLR scanners transmit an invisible infrared laser beam to a point on the measurement surface and coherently process the reflected light. The beam passes through a reference path of a calibrated optical fiber. The two paths are combined to determine the range to the point that, when combined with angular information from two encoders, provides the position of the measured point in space. CLRs are capable of long-range (up to 150 ft) measurement and have a usable accuracy of 0.004 inch and upwards. They are relatively slow to operate but can run unattended and can successfully measure on black or reflective surfaces. In addition, CLRs provide high-quality point cloud data, virtually without small random uncertainties in the points. And CLRs can be used with certain measurement techniques to measure hard-to-access objects. For example, a CLR and a front-silvered mirror can be used to measure the underside of a vehicle or the inside of a gun barrel.
Computed Tomography (CT)
Finally, although CT is not a portable technology, it is mentioned here because of its ability to determine internal damage of, for example, body armor. CT is an imaging procedure that uses computer-processed X-rays to produce 3-D visualizations of the inside of a part. X-rays through the part provide many cross-sectional images, which are then used to construct a 3-D image. CT scanners provide high-quality models of internal components (accuracy is from 0.001 inch) without damaging the part. Unfortunately, CT scanners are large and fixed and among the most expensive solutions.
Practical Examples of Geometric Modeling
The particular metrology tool chosen for a project or part of a project depends on a number of factors, including:
- The accuracy required for the modeling.
- The time allocated to the data collection phase of the measurement task.
- The size of the part or vehicle to be measured.
The previously listed Tables 1 and 2 provide examples of typical contact and noncontact measurement devices that may be found in the inventory of a well-equipped metrology service provider. The characteristics and specifications of these devices (which are also given in Tables 1 and 2) thus provide the type of information metrologists and others should consider to ensure appropriate equipment selection.
The following three 3-D geometric modeling projects provide practical examples of different measurement requirements, as well as the metrology equipment needed for those projects to be successfully completed. Note that, in some cases, multiple equipment types were suitable for the work, but the final selection depended on practical considerations such as equipment availability.
Arena Test Support
The U.S. Army Research Laboratory (ARL) Weapons and Materials Research Directorate (WMRD) at Aberdeen Proving Ground, MD, required geometric modeling in support of ongoing arena test programs. These tests are typically conducted to determine the dispersion of fragmentation and collateral damage on the detonation of a missile or warhead, and metrology support was required during each of the following test phases:
- Pre-test determination of the location of the test components
- Post-test determination of the fragmentation impact locations on the array of witness panels
- Post-processing of the collected data to determine the fragmentation dispersion patterning.
Metrology data were collected with an iGPS contact measurement device, consisting of a dual-sensor vector bar and two transmitters. The following steps were required to collect and process the measurements and prepare the data for delivery:
- The location of the threat detonation, the size and shape of each panel in the arrays, and their relative positions to each other were surveyed in approximately 4 hr (see test setup in Figure 5).
- The 3-D coordinates of approximately 1,000 fragmentation locations on the witness panels arrays were collected. The iGPS’s ability to quickly store and label coordinate points allowed these data to be collected in approximately 8 hr.
- A 3-D computer model of the test arena, including the array of panels, the threat location, and the dispersion pattern of the fragmentation, was generated (see Figure 6).
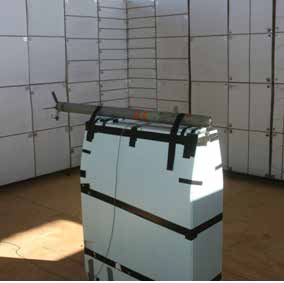
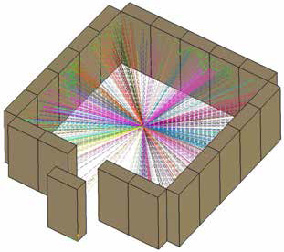
Figure 5: Arena Test Setup. Figure 6: 3-D Model Showing Test Setup.
Buried Blast Crater Analysis
ARL’s Survivability/Lethality Analysis Directorate (SLAD), also at Aberdeen Proving Ground, MD, performs analyses of buried blast craters for battlefield forensics and for the verification and validation of predictive finite element analysis (FEA) and computational fluid dynamics (CFD) models. There were two main requirements for the measurement and modeling of these craters:
- The measurements must be accurate enough to support the forensic and computer modeling requirements.
- Field data must be captured rapidly so as not to delay the testing schedule.
The Mantis Vision F-5 was a good fit for this task. It is lightweight and stand-alone (as it is battery operated and is operated by its own tablet computer). Crater surface data can be captured in minutes, which is much quicker than with other measurement systems. In addition, the 0.2-inch accuracy easily met the test requirements. Post-processing and analysis of the large amounts of data collected did take several hours, but this time investment was regarded as a reasonable trade-off and did not impact the test schedule. The resulting surface model deviation plot is shown in Figure 7.
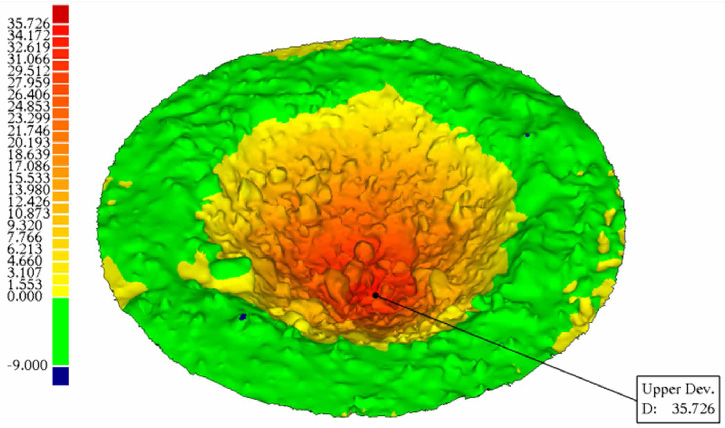
Figure 7: Crater Surface Model Deviation Plot.
MRAP Cougar Modeling
The U.S. Marine Corps in Quantico, VA, required 3-D models to be created of variants of the MRAP Cougar vehicle for testing and space claim purposes. The space claim requirement of this modeling is so that adjustments can be made to the vehicles in the form of additional instrumentation, antennae, and weapon systems. The following three measurement systems were used for this task:
- The exterior of the vehicles was modeled using the iGPS system (see Figure 8).
- The interior of the vehicles was modeled using the point-probing capability of measurement arms.
- The engine and suspension were measured using the SURVICE Reverse Engineering (SRE) system, which is a customized system developed by the SURVICE Engineering Company that employs a measurement arm and specialized software, allowing for a “direct to CAD” modeling process (see Figure 9). SRE allows complex models to be built up feature by feature at the measurement site. As the metrologist has the vehicle part in front of him while the model is being constructed, errors are much less likely. It is thus possible to quickly and accurately generate highly detailed models. Data collection is admittedly slower using SRE, but little post-processing is required.
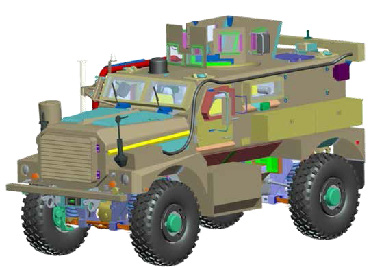
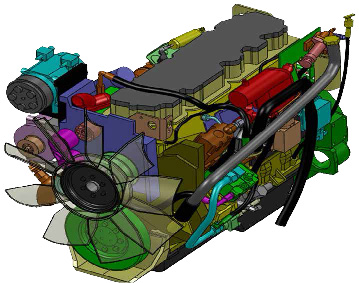
Figure 8: MRAP Cougar Cat I A2 Model. Figure 9: Detailed Cougar Engine Model.
Conclusion
As discussed in this brief overview, many good metrology tools currently exist to facilitate effective modeling for test support. And new tools continue to appear on the market every day. As they do, careful selection and application of these devices will continue to be important in helping to ensure that measurement tasks and subsequent models successfully meet the accuracy and detail requirements for each project and that the results delivered are both timely and effective.
References:
- Hardin, Mickey, Kyle Herr, Rob Baltrush, Jaimie Lalone, Greg Prince, and John Davis. “MRAP COUGAR – Target Model Briefing.” SURVICE Presentation, SURVICE Engineering Company, Belcamp, MD July 2011.
- Raja, Vinesh, and Kiran J. Fernandes (editors). Reverse Engineering: An Industrial Perspective. London: Springer-Verlag, 2008.
- SURVICE Metrology. “Arena Test Summary.” SURVICE Engineering Company Internal Report, Belcamp, MD, undated.
- SURVICE Metrology. “Crater Scanning of Soil Blast Damage.” SURVICE Engineering Company Internal Report, Belcamp, MD, December 2012
