BACKGROUND
Ongoing research at the Georgia Tech Research Institute (GTRI) has resulted in the development of a ground-target tracking module (GTTM) for the MATLAB®-based Adaptive Sensor Prototyping ENvironment (ASPEN™). ASPEN™ is GTRI’s primary tool for modeling and simulating airborne and space-based radar operation and assessing target detection and parameter estimation performance. It is a physics-compliant terrain scattering model that simulates ground returns by employing a large number of discrete point scatterers judiciously positioned and spaced to replicate the space-time statistics of radar returns from terrain, as observed by an airborne radar. The model was originally created to support Space-Time Adaptive Processing (STAP) technique development.
Early versions of the model included prediction and benchmarking of ground moving target indication (GMTI) detection and estimation system performances, as well as the generation of synthetic data sets for algorithm maturation and refinement. In recent years, the simulation environment has been augmented to support a variety of modes and missions, such as air-to-air modes for airborne fire-control radars, wide bandwidths, and long dwell modes for systems such as synthetic aperture radar, urban operations, coherent change detection as observed from multi-pass collections, persistent surveillance, dismount detection and characterization, space-based operations, bistatic and multi-static implementations, electronic attack and electronic protection, radar operation from small unmanned aerial vehicles, and multiple simultaneous waveform transmission.
Additionally, the model has been extended to accommodate arbitrary waveforms and “true-time” referencing, which allows measured data files containing I/Q time samples to be read into the simulation environment and used as templates for radar returns from targets and ground clutter scatterers. ASPEN™ has also been extensively validated against test data collected from several radar systems operating from ultra high frequency (UHF) up through the Ku band, providing a high level of confidence in its representation of radar phenomenology.
ASPEN™ Structure
ASPEN™ functionality may be partitioned into two operations: synthesis and analysis. Synthesis is the generation of data realizations and signal statistics using high-fidelity models of the radar system and environmental effects. Data realizations are normally data cubes with dimensions assigned to the number of channels, slow-time pulses, and fast-time sample/range bin. Signal statistics are typically represented as space-time covariance matrices. Simulated targets can include moving ground and airborne vehicles, stationary discretes, distributed surface clutter, jamming, and thermal noise.
Analysis includes a variety of classical and modern spectral estimators for diagnostics; a complete set of deterministic and adaptive GMTI filtering architectures; and calculators for statistical and stochastic benchmarking measures, such as signal-to-noise ratio (SNR), signal-to-interference-plus-noise ratio and related losses, probability of detection, probability of false alarm, and Cramér-Rao Lower Bounds on the estimation error for various target parameters.
The baseline environment has modules for post-filter processing of synthetic and measured data, including a variety of constant false alarm rate detectors and direction-of-arrival estimators. Recent improvements to ASPEN™ include the ability to capture wideband and long-dwell phenomenology, as well as other enhancements, allowing performance benchmarking and data processing of multi-channel synthetic aperture radar (SAR) implementations. Graphical user interfaces (GUIs) have also been developed to facilitate the operation of ASPEN™ derivatives tailored to specific projects.
Synthetic Clutter Generation
The principal product of ASPEN™ for a source of interest is a data cube, a complex (I and Q) record as a function of fast-time (pulse repetition interval), slow-time (over the coherent processing interval), and channels. A separate data cube is formed for each signal source; these cubes are then coherently combined as the user desires, consistent with the assumption of linear superposition at the radar. Signal sources include external and internal thermal noise, distributed ground and ocean clutter, ground-based discrete scatterers, primary moving targets of interest, secondary “nuisance” targets, noise jammers, coherent jammers, and dismount signatures.
Distributed clutter is the most challenging signal source for data cube generation. Fundamentally, distributed clutter is modeled as a large number of stationary discretes, known as “clutter patches.” A precalculation step establishes the number and properties of these patches. By defining the scenario, the user implicitly influences the size of the area modeled with patches. For example, if the scenario is a fine-resolution, spotlight SAR collection, small patches might be defined and constrained to mainbeam angles and swath ranges only. Alternatively, for a medium-pulse-repetition-frequency mode where range- and Doppler-ambiguous clutter is a concern, larger patches will likely be defined for all angles from nadir to horizon.
Each clutter patch is modeled as a point-like scatterer, with the phase drawn randomly from a uniform distribution and the amplitude drawn from a Rayleigh distribution. The Rayleigh mean for a patch is set to a level consistent with the average clutter power at that location. The clutter reflectivity used to determine average power is a function of operating frequency, local grazing angle, and land type. Each clutter facet also has a deterministic spatial and temporal response, the former a function of the elevation and azimuth angle to the facet and the location of the receive channel phase centers, and the latter determined by the pulse-to-pulse phase progression generated by the relative motion of the sensor platform.
The default ASPEN™ mode of operation represents distributed clutter with a spherical, “sandpaper” earth—that is, the reflectivity model is a constant-gamma function with gamma invariant over all slant ranges and azimuth angles. The site-specific implementation, in contrast, uses digital elevation information to construct a true three-dimensional model of clutter patch locations and orientations. In this mode, ASPEN™ checks whether a given patch is shadowed by intervening terrain; if not in a shadow, the terrain type and grazing angle for the patch is used to determine reflectivity and, from the radar range equation, average power.
GTTM DEVELOPMENT
GMTI signal processing is typically developed for specific radar data collections or simulations. Until now, there has been no “quick-look” capability to help assess big-picture, system-of-systems performance with “generic” GMTI track capabilities. Recent research helped to fill this gap by implementing a novel signal processing chain and developing a tracking module with six different tracking architectures [1]. An accepted set of baseline tracking algorithms with adjustable parameters facilitates faster and more reliable analysis of problems of interest.
GTTM Technical Approach
Experience gained from processing both measured and simulated data was leveraged. Signal processing algorithms were implemented to process ASPEN™ raw detections. New outputs for this new module include tracks and associated metrics.
Initial parameters for the tracking architectures were chosen based on simulated vehicle motion; however, parameters may be adjusted for other datasets, scenarios, and operating environments. Realistic ground moving target scenarios were implemented using MATLAB. A user-friendly, visually interactive target/vehicle scenario module was developed to provide an interactive graphical approach for direct addition of trajectory data samples. Samples are created in the East-North-Up coordinate system on a high-resolution Google Map™ terrain figure. The open-source MATLAB script, Plot Google Map, was obtained from the MathWorks® file exchange and incorporated to generate terrain plots [2].
Accommodations of various ground-based environments are provided since the module is scripted to accept minimum and maximum latitude and longitude values. Operating within the defined terrain figure, the user can outline the desired ground target motion via a simple computer mouse click. To ensure all user-defined target motion inputs follow physical constraints and match real-world behavior, only user inputs falling within the specified maximum velocity constraint and revisit increment interval are accepted. Lastly, the target motion scenario is processed to obtain the detection performance in a simulated radar environment. These detections are processed as input measurements by the specified tracking architecture.
Six tracking architectures were developed with different initial parameters and levels of complexity. These six code bases provide options for comparisons and quick-look results. Additionally, they form the basis for developing problem-specific tracking. The codes can be grouped according to the type of filter, level of complexity, or target(s) of interest. Grouping by filter type, three codes employ a single Extended Kalman Filter (EKF) to estimate track motion. The other three codes use an Interacting Multiple Model (IMM) of two EKFs; the two EKFs have different process noise values (one is conservative, and one allows for more uncertainty). Similarly, the six codes can be grouped according to the levels of complexity. The simple versions assume there are no features associated with measurements. The alternate version does include potential features (e.g., radial velocity, SNR, etc.) to adjust the size of the data association gate. Finally, the codes can be sorted based on the target class of interest. Four of the codes operate only on vehicles, while the other two operate on vehicles and dismounts and include an additional EKF for those detections classified as dismounts.
All six code bases exhibit the same structure regarding variables and general architecture. First, all tracks require a set number of detections similarly located to form a firm track—the required number is an input into the tracking module. At each time step, current measurements are compared to existing tracks to determine if they should associate with a track or start a new track. Additional logic determines whether a track should be labeled as tentative, firm, or dropped.
GTTM Development Results
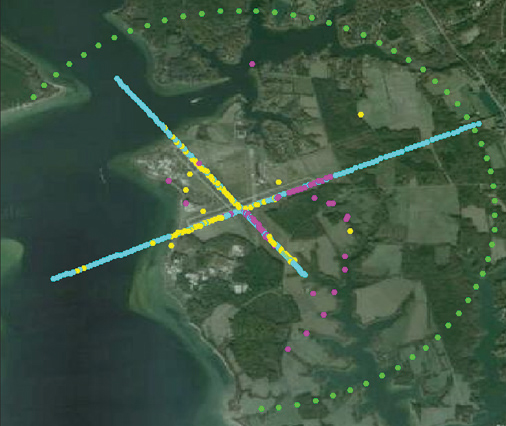
Two examples of tracks generated by the new ASPEN™ module are provided in this section. In the first scenario, four vehicles move outward from the same location at the center of the scene, as shown in Figure 1. The detections (magenta indicating inbound targets and yellow representing outbound targets) and truth (cyan) for four vehicles are overlaid on the Google map©. The green dots indicate the radar platform position. This figure is a snapshot in time, showing all detections up to that point. The x- and y-axis display longitude and latitude, respectively, both measured in degrees.

Figure 1: Scenario 1 – Radar Detections, Truth Data, and Platform Position Overlaid on a Terrain Map.
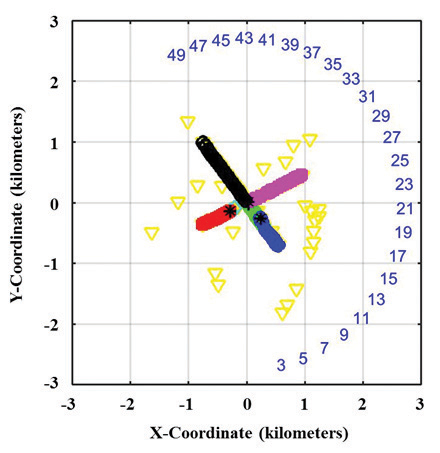
Vehicle tracking results (Scenario 1 with the IMM architecture) are illustrated in Figure 2. Detections are shown in cyan. Each of the four tracks is indicated with a different color, and a black asterisk designates the beginning of each track. Platform positions are updated and numbered in the order in which they appear. SNR and radial velocity are used in the data association process, as is the estimated target class (human, vehicle, animal, or clutter). Four tracks, with track lengths ranging from 20 to 45 track-state updates, are shown. For this scenario, track updates occur at 0.5-Hz intervals, and track lengths of 40 to 90 s are observed for a scenario lasting a total of 100 s.

Figure 2: Tracking Results for Scenario 1.
An example scenario comprising a single vehicle driving a complex road network is shown in Figure 3.

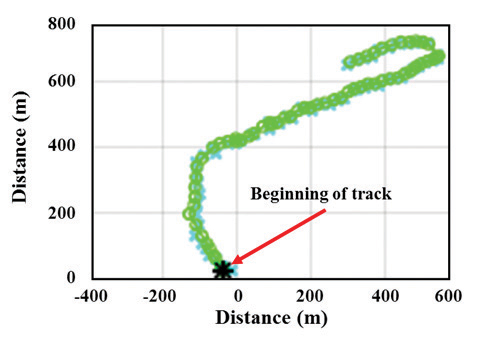
Figure 4: Zoom-In View of Simulation for Previously Depicted Scenario (Detections in Cyan; Tracks in
Green).
EKF tracking architecture results are illustrated. The simple architecture assumes there are no features such as SNR or radial velocity to aid in the data association process. Target class (human, vehicle, animal, or clutter) is not included. A single track, with a track length of 63 track-state updates, is observed. For this scenario, track updates occur at 0.5-Hz intervals, yielding a track length of 126 s for a scenario lasting a total of 130 s. A view of the track is depicted in Figure 4.
CONCLUSIONS
The development of a flexible GMTI tracking capability in the ASPEN™ modeling environment is adding “big-picture” assessment to robust modeling of GMTI environments, architectures, and algorithms. In addition, the various advancements that this capability incorporates—including the creation of realistic simulated data sets via an interactive graphical approach, the establishment of a signal-processing architecture to support the tracking functionality, the development and implementation of a tracking module comprising six different track filters, the simulation of realistic vehicle detections, etc.—are proving the value of this tool for continued development and analysis of GMTI tracking functions.
References:
- Hersey, R. K., and E. Culpepper. “Radar Processing Architecture for Simultaneous SAR, GMTI, ATR, and Tracking.” IEEE Radar Conference, May 2016.
- The MathWorks. “Plot Google Map,” http://blogs.mathworks.com/pick/2012/05/04/plot-google-map/, accessed February 2016.

