Introduction
Ballistic vulnerability can be difficult to understand in a timely and accurate fashion. Interactions between threats and targets are complex and unwieldy—and so are the codes used to simulate such events on an analyst’s behalf. Typical analysis is conducted on large clusters, environments for which interactive simulation is not feasible. As such, analysts often spend large amounts of time creating inputs, large amounts of time waiting for simulations to execute, and even larger amounts of time sifting through output data to identify results of interest.
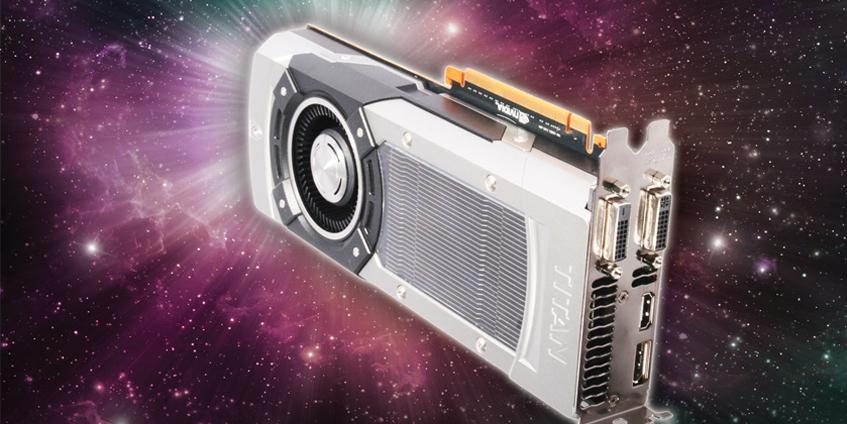
Meanwhile, high-performance computing architectures have been changing such that existing software is unable to trivially take advantage of the newest advances and features: program execution has progressed from being exclusively serial on the central processing unit (CPU) to being parallel both on the CPU and on massively parallel coprocessors, such as the graphics processing unit (GPU) pictured in Figure 1.
Parallel processing provides the ability to execute multiple computations in the same time-cost of a single computation. Modern computing systems exhibit several types of parallelism, including bit-, instruction-, and data-level parallelism, as well as task parallelism. Our target hardware architecture, the GPU, dictates that data parallelism be exploited to fully leverage hardware resources. In this article, we describe a software architecture for ballistic simulation that leverages data-level parallelism, and we discuss a prototype implementation on the GPU. Our results demonstrate that, when programmed carefully with a full understanding of the underlying hardware constraints, GPUs can execute the computations necessary to complete ballistic simulations at interactive rates on a single workstation.
Ballistic Simulation
Vulnerability analysis consists of running one or more ballistic simulations to better understand the relationship between threats and targets. Ballistic simulation, in turn, involves the interaction of a nontrivial number of input parameters and results in system-level probability of kill (pk) outcomes between a target and a set of threats.
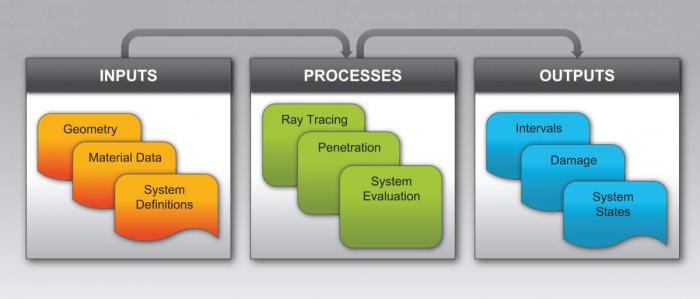
Analysts seek insights regarding effects on various system pk values from a particular threat. Input traditionally comes from various description files that combine during a simulation run. Output of a shotline instance is a set of requested pk values. While numeric values suffice for some questions analysts seek to answer, visuals that depict the results of a collection of shotlines can also be of value in understanding simulation outputs. This basic process is illustrated in Figure 2.
Figure 2: Stages in a Typical Ballistic Simulation, Involving Various Input (e.g., Target Geometry, Material Properties, and System Definitions) and Output/Visualization Forms.
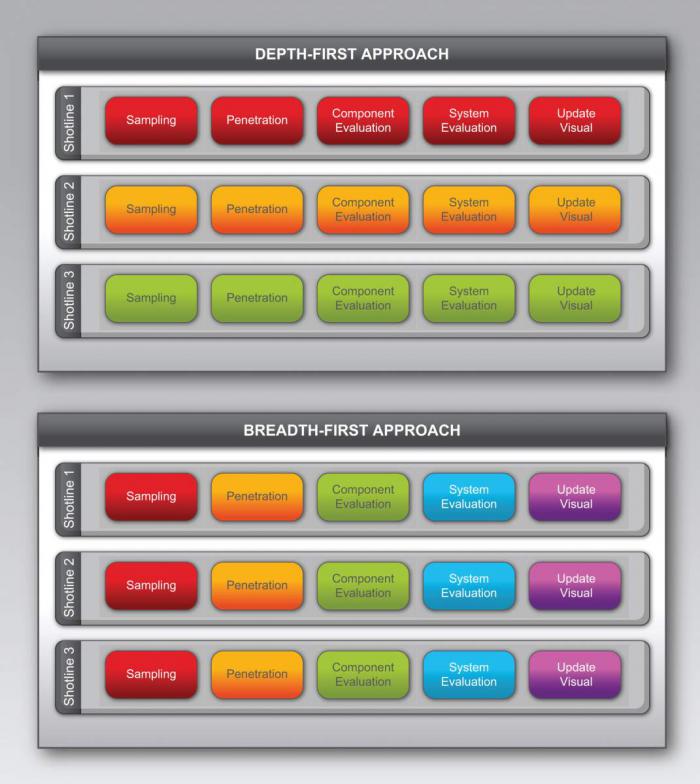
Existing ballistic simulation codes employ a depth-first approach: each stage of simulation is computed from start to finish in a sequential manner (as illustrated in the top panel of Figure 3). Until a decade or so ago , this computational model excelled by taking advantage of rapidly increasing CPU clock rates. However, massively parallel coprocessors, such as GPUs, typically operate as data-parallel devices: using the large volume of available cores, one task is executed across multiple data elements [1]. To maximize utilization of these devices, computations must be grouped in a breadth-first manner, executing only a few distinct instruction streams on the largest possible volume of data at any one time (as illustrated in the bottom panel of Figure 3). This approach requires a significantly different organization of both data and computation compared to existing codes.
Figure 3: Depth-First vs. Breadth-First Computation (Note: Color Indicates Operation Grouping and Order of Execution).
Systems Architecture
GPUs provide computational resources that have not yet been exploited by modern vulnerability analysis applications. With additional computational power, new application use-cases are possible. The software architecture described in succeeding text not only best leverages modern massively parallel hardware architectures but also provides performance sufficient to enable both real-time vulnerability analysis and interactive visualization of all shotline simulation stages, both of which are features not common to existing codes.
GPU Hardware Architecture
GPUs provide significant performance gains when algorithms are designed to exploit their underlying hardware configuration. While several implementations of massively parallel coprocessor architectures are available, many share a common computational model: data-level parallelism. The single instruction, multiple data (SIMD) model is one approach to data-level parallelism in which a single instruction stream executes across multiple data streams simultaneously, as illustrated in Figure 4. To exploit the benefits of data-level parallelism, programmers must understand and use these SIMD coprocessor architectures carefully and correctly.
Figure 4: SIMD Hardware Architecture.
SIMD architectures impose the constraint that all vector units associated with a single control unit execute the same instruction across a group of data elements. Most implemented SIMD architectures support wide memory fetch operations that fill an entire SIMD vector unit in a single fetch. These memory operations take several orders of magnitude longer to execute than a SIMD arithmetic operation, so arranging data elements in a manner that minimizes memory fetches per SIMD unit in turn maximizes simulation data throughput, ultimately leading to higher performing code. A GPU’s underlying SIMD architecture thus dictates that computations be arranged as stages spanning the range of simulated shotlines.
Simulation Pipeline
We decompose the fundamental computations necessary to execute ballistic simulation into logical subcomputations that map directly to modern GPU architectures. The fundamental computations are:
- Threat Initiation
- Geometry Sampling
- Threat Penetration
- Component Damage Evaluation
- System Evaluation
- Visualization.
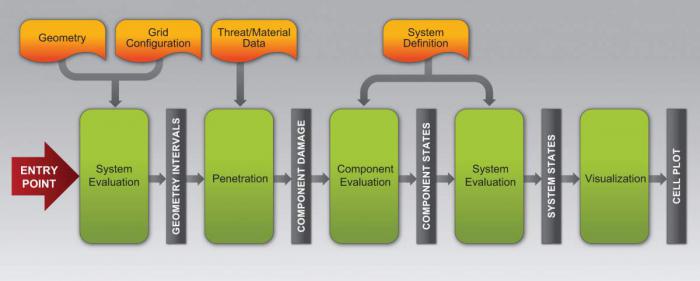
Each stage takes input data, executes a set of operations on those data, and creates a result set of data that serves as input to the next stage. The progression of data elements through each stage creates a simulation pipeline that has a defined initial configuration and expected form of output, as illustrated in Figure 5.
Figure 5: A GPU Ballistic Simulation Pipeline, With Each Stage of Computation Comprising an Individual GPU Kernal.
This configuration has two distinct advantages. First, data between each stage can be transferred from the GPU and visualized in their entirety, thus providing the ability to communicate trends showing not only what data are computed but also how they are computed, thereby illustrating interactions between pipeline stages. Second, this configuration ensures that GPUs execute the same instructions on local data, which is critical to performance.
Due to the massively parallel nature of GPUs, executing simulation operations at high volume is necessary to fill the computational cores and memory of a device. We thus assume that a full simulation executes a set of many individual shotlines simultaneously—for example, all shotlines in a high-resolution grid layout with a particular view of the target.
Threat Initiation. The first stage of our pipeline is threat initiation. Threat initiation refers to the process of discovering the location and orientation at which the main weapon is fused. Ballistic simulation packages handle the arrival of threats at their fusing location differently because weapons are evaluated by analysts in different ways. In our pipeline, this relatively low-cost computation is either provided directly as input or is itself physically simulated, depending on requirements. The result is an initial origin and direction at which the weapon has fused.
Geometry Sampling. The next stage takes weapon configurations and samples target geometry to generate intervals according to that configuration. Weapon configurations are sets of data to initialize the threat state before penetration begins. Sampling geometry on a massively parallel architecture can proceed in many different ways; we chose ray tracing. Each ray trace operation follows the path of a single threat, such as a shaped charge jet or artillery fragment. While the details of this process are not within scope, there are issues that the interval construction process must be able to handle, such as tolerance for geometric overlap and correctly handling in-plane ray/geometry intersection [2]. Our ray tracing subsystem handles these issues correctly and robustly. The resulting interval data correspond to objects with which a given threat might interact during penetration.
Threat Penetration. Penetration follows geometry sampling and, in addition to initial threat and material information, takes intervals as input. The computation selects one penetration model from a collection of such models and loads corresponding material data. The bulk of a simulation’s computation follows, as threats are propagated along intervals. Threat propagation creates a collection of component damage information and a collection of secondary threat information, such as armor spall fragments.
Damage Evaluation. After the penetration stage completes, damage information is evaluated for each component in the target. Component damage evaluation may require additional information about the correspondence between damage to a given component and the resulting pk. This additional information is called an evaluation mode, and different evaluation modes can be used in a single simulation to explore different types of results. As an example, one mode may determine if a threat simply hits a component, while another may determine if the threat creates damage above some threshold, thereby resulting in a killed component.
System Evaluation. The system evaluation stage takes pk values from the component evaluation and aggregates new pk values based on system definition inputs. Similar to the component evaluation, the system evaluation may have various modes of evaluation.
Visualization. The visualization stage typically operates with system pk values to generate a visual representation of the simulation results. An example is found in shaped charge jets arranged in a grid—the visualization may be a plot of colors representing output pk values with one color per shaped charge instance.
Secondary effects may be computed at various points during simulation, depending on application requirements. For example, if only the impact of a grid of shaped charge jets—and not secondary spall fragments—is of interest, the pipeline architecture completes computation on the main penetrator and generates a visualization before the pipeline for spall is computed. However, only after all primary and secondary effect pipelines are complete is the simulation itself considered to be finished.
Prototype Implementation
We implement a prototype simulation pipeline using the software architecture described previously to demonstrate both the capability and performance of ballistic simulation on modern GPUs. Our implementation is written in C++ and uses NVIDIA CUDA C/C++ for GPU computations [3].
The CUDA programming model exposes GPUs as multi-thread processors in which all threads execute a single kernel, or common code entry point. Threads are grouped in so-called blocks and run on top of SIMD groups, called warps. Warps execute in SIMD fashion, but CUDA allows threads to diverge. Divergence measures differences among a series of instructions executed across a collection of independent threads. Divergence within a warp introduces instruction-level overhead and can also introduce extra, often highly expensive, memory fetches. Both instruction-level overhead and additional memory fetches are likely to have significant impact on performance, so careful attention must be given to these issues during implementation. Each kernel is called by the host application asynchronously and runs until all threads complete.
Our implementation receives necessary simulation inputs from the host application, which provides the following general capabilities:
- Loading and Viewing Geometry in 3-D
- Annotating Geometry with Material Data
- Creating, Loading, and Editing System Definitions
- Creating and Modifying Initial Threat Parameters.
Each stage of computation described in the preceding Simulation Pipeline section comprises an individual CUDA kernel, as illustrated in Figure 5. Inputs to any one stage are subdivided if the data (including inputs, outputs, and temporary values) are larger than device memory. Output buffers are therefore transferred back to host memory when available. This approach not only allows large simulations to execute within the sometimes-limited memory of GPU devices, but it also facilitates flexibility. For example, data in host memories are easier to inspect and therefore debug. Moreover, data in host memories can be easily transferred to downstream computations executing on devices other than the GPU.
The threat initiation kernel converts a view configuration from a 3-D geometry viewer to the initial set of shotlines, with one shotline per display pixel. These shotlines are used to launch rays that sample the target and generate intervals during geometry sampling. Rays are traced with Rayforce, an open-source high-performance GPU ray tracing engine (see http://rayforce.survice.com).
The penetration kernel calculates threat penetration along interval output from Rayforce. This kernel takes data about an initial threat for a selected penetration equation as input. We currently implement both THOR [4] and Line-of-Sight (LoS) penetration equations. The LoS equation simply aggregates material thickness penetrated by the threat and records whether or not components are located within an input threshold. The output damage buffer contains information about threat state and damage information for each component along the shotline.
The component and system evaluation kernels take input data and generate pk values as output. The component evaluation kernel calculates pk values for each component along the shotlines from damage information. We optimize memory consumption by storing only component pk values for components that appear in the final output. The system evaluation kernel then aggregates component pk values according to the current system definition.
Finally, the visualization kernel maps system pk values to pixel colors for each shotline according to a single top-level system selected by the user. Pixel colors are then displayed as an image that is the same resolution as the original 3-D geometry viewer window.
We benchmark our prototype implementation, which is part of the Visual Simulation Laboratory (an open-source simulation and visualization framework [see http://www.vissimlab.org]), on a workstation with two 8-core 2.66-GHz Intel Xeon CPUs, 16 GB of host memory, and a single NVIDIA GTX Titan GPU with 6 GB of device memory. To demonstrate the implementation in a nontrivial scenario, the target geometry contains 1,167,791 triangles, as shown in Figures 6a and b. The results, depicted in Figure 6c, are generated from a 1,024 x 1,024 grid of shotlines, where more than 500,000 shotlines actually intersect target geometry (rather than empty space). The entire image is computed in 0.333 s, resulting in more than 1.5 million shotlines completed per second.
Figure 6: Ballistic Simulation on the GPU.
Impact and Future Work
Breadth-first ballistic simulation, when implemented according to the architecture discussed previously, enables various advantages over depth-first approaches. First, using the computational power of the GPU enables single-view analysis to be computed in real-time on a single GPU. Second, data of interest to a user can be visualized immediately, without waiting for other results in the simulation to complete. Thus, analysts can begin to understand the results of one pipeline iteration while other, potentially more expensive, iterations are computed.
The combination of real-time simulation and visualization enables users to adjust input parameters as simulations execute. Traditionally, minor changes to input data introduce large workflow time-cost because all shotlines must complete before trends present in any output can be assessed. However, in our architecture, only certain stages of simulation need to be re-executed when parameters change. Thus, trending results from minor input changes can be visualized and understood immediately, enabling analysts to answer questions concerning vulnerability that were previously inaccessible.
While real-time, single-instance simulation provides new vulnerability analysis capabilities, large-volume batch simulation is still important to certain analyses. The simulation architecture presented herein, combined with modern massively parallel coprocessors, can drastically increase batched simulation volume. This effect itself is beneficial because larger computed datasets enable higher-fidelity answers as a result of higher-resolution inputs and results.
Going forward, the subject architecture will be implemented and demonstrated in a complete, end-to-end ballistic simulation application on a single workstation. Additionally, trends in the capability and programmability of low-power CPUs and GPUs suggest that an implementation of this architecture on mobile devices is well within reach, so the exciting possibilities enabled by such a system will continue to be explored.
Acknowledgments:
The authors acknowledge the principal contributing members of the VSL development team, led by Mr. Lee Butler (from the U.S. Army Research Laboratory) and including Messrs. Mark Butkiewicz and Scott Shaw (from the SURVICE Engineering Company); Cletus Hunt (from Applied Research Associates); and Ethan Kerzner (from the University of Utah).
References:
- Boyd, Chas. “Data-Parallel Computing.” ACM Queue, April 28, 2008.
- Gribble, Christiaan, Alexis Naveros, and Ethan Kerzner. “Multi-Hit Ray Traversal.” Journal of Computer Graphics Techniques, vol. 3, no. 1, pp. 1–17, 2014.
- CUDA Toolkit Documentation, v6. http://docs.nvidia.com/cuda/index.html. Last accessed August 1, 2014.
- Ball, Robert E. The Fundamentals of Aircraft Combat Survivability Analysis and Design. 2nd edition, Reston, VA: American Institute of Aeronautics and Astronautics, 2003.


