INTRODUCTION
The growing proliferation of concealed improvised threats (e.g., explosives and chemical warfare agents [CWAs]), has created a critical international need for systems and devices that can identify hidden or camouflaged hazardous materials. Military, federal, and state organizations require instrumentation that can be easily carried by personnel who are monitoring or investigating a location or scene. Operations for such scenarios are generally more interested in the qualitative—“Is a threat material present?”—rather than the quantitative aspect. Knowledge of the presence of a hazardous material is critical for determining the appropriate response. Covert threat analysis operations often involve conducting rapid material analysis (in a 1- to 5-minute time frame), testing samples with less than adequate protection (e.g., little to no personal protective equipment [PPE]), and having to avoid drawing unnecessary attention to the site of a potential hazard.
The current collection/analysis tools of choice for these activities include colorimetric test kits, hand-held optical spectrometers, and miniaturized mass spectrometry systems. Even with recent technology advances in some of these areas, threat sampling is a proximity problem for the majority of them. An investigator must get close to, or even touch, a suspect item, which further exposes the investigator to the threat and requires additional time to investigate. The use of standoff vibrational spectroscopy (e.g. Raman or infrared [IR]) as a rapid method for uniquely identifying suspicious materials from a safe distance (>3 ft) has thus been a focus in academia and laboratories for many years [1]. Recently, however, Alakai Defense Systems (ADS) has developed a standoff solution, the man-Portable Raman Improvised Explosives Detector (PRIED), to get this technology out of the laboratory and into the field.
PRIED combines all the capabilities of a high-sensitivity bench-top Raman system into a compact, ruggedized package that can be worn and employed by a single operator. The device can detect and identify bulk and high-trace levels of substances of interest from several meters in a few seconds using deep-ultraviolet (DUV) illumination. This article describes key aspects of PRIED and characterizes employment of the instrument for pharmaceutical and counter-narcotics applications. Though these applications are likely to be of greater interest to the domestic law enforcement and first responder community, the principles are transferable to those involved in explosives detection operations.
PRIED DESIGN AND OPERATION
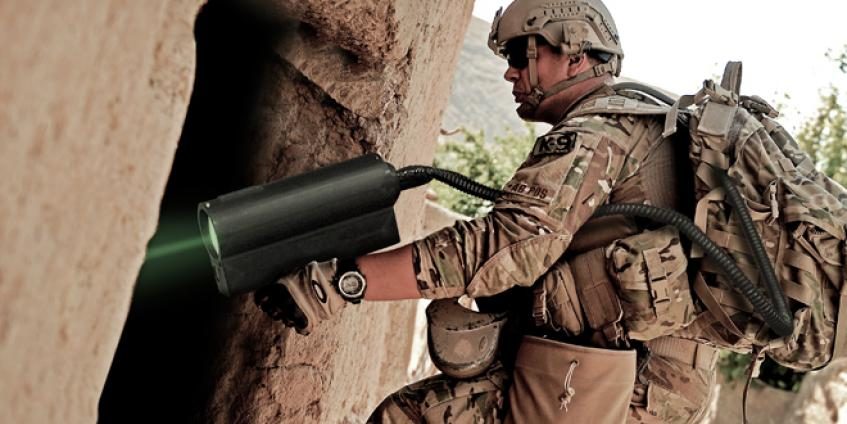
PRIED is a revolutionary improvement of the Checkpoint Explosive Detection System (CPEDS). CPEDS, now in its third generation after 8 years of development sponsored by the U.S. Army Research Laboratory (ARL), is a 248-nm Raman system that is transportable by vehicles such as Utility Terrain Vehicles (UTV). CPEDS has been tested extensively in government trials and has demonstrated Raman detection of bulk explosives and explosive residues at ranges in excess of 25 m. The results of this testing are not publicly available, but they confirm that DUV Raman is able to identify high-trace concentrations of materials at standoff ranges [2]. ADS’s patented stimulated aversion eye-safety technology gives CPEDS a nominal ocular hazard distance (NOHD) of 0 m. PRIED’s engineering and design captures both the close-range performance and the eye-safety feature of CPEDS, while reducing the weight and power consumption from 650 lbs and 1.6 kW to less than 40 lbs and 130 W. Figure 1 provides a visual perspective of the size of a PRIED system in use by an adult male.

Figure 1: Man-Portable Raman Improvised Explosives Detector (PRIED).
The PRIED backpack, which weighs 31 lbs, contains a thermal and power management systems, computer, iCCD camera, and spectrometer. The backpack is connected to the hand-held sensor head, referred to as a “wand,” via an umbilical cord. The wand, which weighs less than 7 lbs, contains the 262-nm laser, visible camera, range finder, eye-safety subsystem, and optics. The wand can be operated in the hand-held mode or attached to a monopod, tripod, or vehicle mount for increased stability when making long-range acquisitions.
PRIED is designed for use in harsh, austere operational environments. Its operation is initiated by a simple manual trigger on the wand. Partially depressing the trigger, similar to the functioning of a single-lens reflex (SLR) camera, activates a green laser pointer/designator and range-finding subsystem. Fully depressing the trigger initiates data collection, which proceeds until a threat material is detected or a system-specified timeout is reached (typically 10 s). While the laser is firing, a blue light-emitting diode (LED) on the top of the hand piece blinks, indicating emission of invisible DUV radiation. At the conclusion of a scan, a simple threat/no threat indicator is presented to the operator by illuminating either a red or a green LED.
Additional information is available to the operator or anyone monitoring the system via an integrated Bluetooth transmitter on an Android® device. Screenshots of the PRIED application are pictured in Figure 2. The main application screen (Figure 2a) displays the measurement history, with a summary result of each measurement. Detected materials are classified as threats, suspicious, or nonthreats via simple icons. In the sample screen, RDX and ammonium nitrate are shown with red octagons indicating known threat materials. Materials not of interest, or nondetects, are displayed with a green circle. Suspicious materials, such as triethylphosphate (TEPO), that have legitimate manufacturing uses but can also be used for narcotics or CWA manufacture are indicated with a yellow triangle. Each measurement can be further investigated on any of the connected devices by viewing a high-resolution recorded image that indicates the target being interrogated and uses global positioning system (GPS) to show exactly where the analysis was performed (Figure 2b). From here, the recorded spectrum can be viewed for quick assessment of data quality. Finally, the PRIED application (Figure 2c) displays system status information, indicating such information as the location of electronic faults, system temperature, and battery lifetime. All data, information, and imagery associated with each detection acquired by PRIED are archived in the system for upload to an incident command system or for later forensic use.
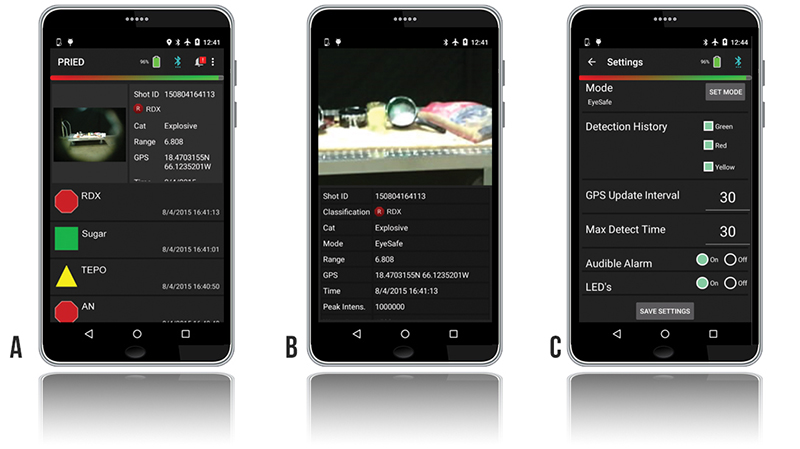
Figure 2: PRIED Android Application (a) Measurement History, (b) Measurement Details with Zoomed-In Image of Sampled Location, and (c) System Settings.
Remotely located or command/supervisory personnel can access the advanced control software directly via network connection to the backpack to access and modify the instrument settings, or they can enter changes directly into the application by providing appropriate credentials (Figure 2c). Changeable operating parameters include, but are not limited to, the PRIED application behavior at the end of scan, the maximum allowable scan time, and the ability to change between eye-safe and max detect (not eye-safe) collection mode.
DUV ADVANTAGES
PRIED uses DUV illumination, which has four major advantages over near-IR Raman wavelengths for standoff applications.
- Raman material cross sections increase with decreasing wavelength by 1/λ4. The cross sections measured by PRIED at 262 nm are about 80 times larger than the average hand-held Raman instrument at 785 nm and 272 times larger than some specialized hand-helds that lase at 1,064 nm [3–8].
- DUV excitation results in Raman spectra that are collected in the solar blind region and are nearly fluorescence free (see Figure 3). Solar background is known to cause interference with Raman using visible and near-IR (NIR) lasers [9].
- Inherent material fluorescence is largely suppressed with DUV excitation as many materials encountered in forensic investigations exhibit strong fluorescence when excited with 785 nm, the most commonly used wavelength for portable Raman systems. To overcome fluorescence, manufacturers are now offering 1,064-nm systems. DUV excitation provides approximately the same level of fluorescence reduction over 785 nm as 1,064-nm excitation, but at 200 times the signal strength.
- DUV Raman has reduced detonation probability of explosives. It is believed that certain Raman systems using tightly focused 785-nm or 1,064-nm sources can cause deflagration or detonation of explosive materials. DUV Raman systems have been extensively tested on an array of energetic materials, such as C-4 (RDX), ammonium nitrate/fuel oil (ANFO), and primary explosives (mercury fulminate), and have not experienced a single initiation or detonation.
Figure 3: PRIED Raman Spectra in the Fluorescence Free and Solar-Blind Region.
EYE SAFETY
The ADS-developed patented eye-safe technology [10] allows for operators to have robust performance without sacrificing eye safety. PRIED is currently awaiting certification by the Army Public Health Command as an eye-safe explosive detection system. The likelihood of this certification is high because PRIED employs the same patented eye-safe technology developed for use in CPEDS (see Figure 4) that has previously been certified as completely eye safe, even if viewed through magnifying optics. In addition, an operational benefit of this eye-safe technology is that the coordinating visible light co-illuminating the DUV beam acts as a pointer beam for a mission operator. If a truly covert operation is desired, the DUV beam is completely invisible to the eye, night observable devices (NODS), or even thermal viewers.
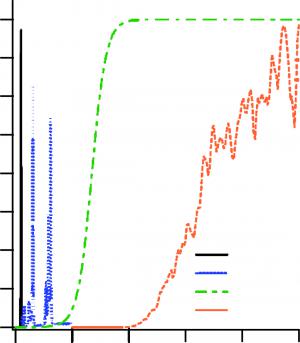
Figure 4: Operating Principle of ADS’s Stimulated-Aversion Eye-Safety Technique.
A collimated UV beam is encased in a slightly diverging green beam. The green beam induces a blink response and causes onlookers to turn away within 0.25 s, preventing UV exposure and allowing increased energy on target. Beyond the range of the intended target, both beams diverge. The technology can be combined with range interruption sensing to shut off the system if a bystander crosses the beam.
ALGORITHM SPECIFICATIONS
PRIED provides identification of an unknown material using built-in spectral libraries and a proprietary algorithm to return a clear, unambiguous answer to a soldier in the field. The algorithm answers the question, “Is a threat material present, even if there are other nonthreat materials present too?” In focusing on the presence or absence of a threat, PRIED is able to achieve much greater sensitivity to threat materials than currently fielded hand-held Raman instrumentation. As with other Raman instruments, PRIED’s search libraries can be customized and narrowed by mission commanders to limit irrelevant results. PRIED is equipped with colored LEDs on the wand, providing a red (threat) or green (nonthreat) response to the operator immediately upon final identification of an unknown. A typical unknown acquisition time at <10 m is 15 s or less.
Within 1 min of identification, additional sample information (including a picture of the scene, National Fire protection Association [NFPA] information, etc.) can be transmitted to an Android™-enabled device, allowing a secondary user or leader to view the results and make appropriate mission decisions. The system of a threat/no-threat notification on board PRIED simplifies site exploitation missions and does not require a soldier to know extensive chemistry to appropriately classify if an identified material is considered a mission hazard. As PRIED is deployed in additional operational scenarios, library growth will continue and further chemometric development for mixture analysis will be implemented.
EXPERIMENTAL
To test the effectiveness of PRIED, a series of experiments was performed on industry standards. All laboratory chemicals were sourced from Sigma-Aldrich (in St. Louis, MO). Narcotics were provided by the National Forensic Science Technology Center, in Largo, FL. Surrogate analytes in the form of locally procured consumer substances were purchased from local retail outlets.
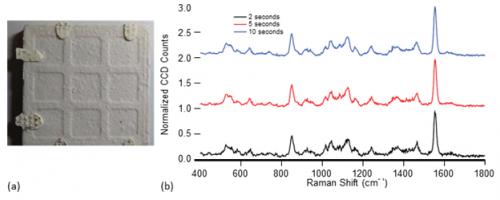
Samples were measured in bulk or near-bulk amounts. We define this amount as a quantity of sample that is sufficiently thick to be seen with the unaided eye and that fills more than three-quarters of the beam footprint at the desired distance. Liquid materials were held in a DUV-transparent sample cell, and solid sample configurations include those similar to the one shown in Figure 5a, in which a few granules of analyte were placed on an unglazed ceramic tile. The samples were typically mounted vertically, so that PRIED could be mounted on a table and normal beam incidence ensured for maximum reproducibility. Integration times were intentionally varied with range to target. Measurements longer than a few seconds were accomplished by supporting the PRIED wand with a monopod or securing it to an optical bench.
Figure 5: (a) Photograph of 1 mg/cm2 of Table Sugar on 40-mm-Wide Ceramic Coupon; (b) Normalized Spectra of Sugar at 2-, 5-, and 10-s Integration Times. Spectra Are Normalized to the Oxygen Peak at 1,554 cm-1 and Offset for Clarity.
Because PRIED was designed with standoff detection in mind for law enforcement and first responders, testing has primarily focused on those applications. The system has been evaluated against a number of materials expected to be present in a clandestine narcotics laboratory for a range of distances and investigation times. Materials that are naturally highly fluorescent have been of particular interest, with evaluators comparing the results obtained from PRIED with those of a commercial hand-held 785-nm Raman system.
RESULTS
Bulk Detection Performance
PRIED testing results discussed here fall into three categories: (1) bulk detection performance, (2) algorithm performance, and (3) narcotic and excipient detection. For the characterization of system performance against bulk common cutting agents, sucrose (granulated table sugar), sodium bicarbonate (commercial baking soda), and acetaminophen (Sigma-Aldrich) were selected. Baseline corrected spectra of these bulk materials collected at 3 m are shown in Figure 6. All of the Raman spectral features of sodium bicarbonate reasonably match those in the literature [11]. The relative intensities of the peaks, however, are different, which is attributable to the difference in excitation wavelength.
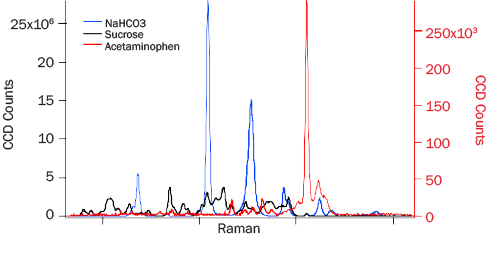
Figure 6: 3-m Data for NAHCO3 (Blue), Sucrose (Black), and Acetaminophen (Red). Acetaminophen Y-Axis Is Approximately 100 Times Smaller Than the Other Two Analytes.
ADS collected spectra of table sugar as a function of range and average power to coarsely evaluate the signal falloff. Figure 7 presents data collected at 2- and 10-m standoff in both max detect (Figure 7a) and eye-safe modes (Figure 7b) after 10 s of measurement. At both 2- and 10-m standoff, the max detect operation gives strong table sugar spectra in 1 s. The difference in spectral intensity is a factor of 2.5 for these two ranges in both modes. The intensity difference relates to how the iCCD in PRIED automatically increases sensitivity with increasing range. Eye-safe operation reduces the energy by a factor of approximately 7, so a longer acquisition time is necessary to obtain a spectrum with the same signal intensity as high-power operation. Despite the signal reduction, high-quality spectra are still generated for this material within a few seconds at both ranges.
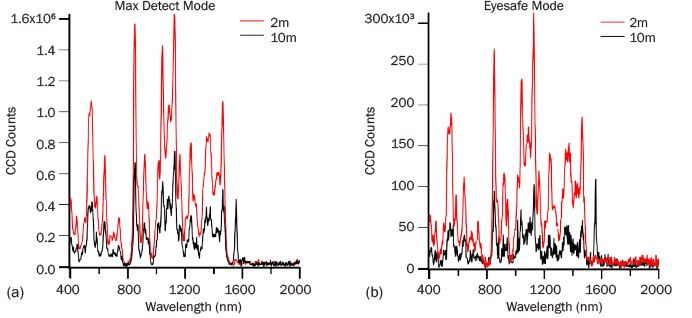
Figure 7: (a) Max-Detect and (b) Eye-Safe Raman Spectra of Table Sugar After 10 s of Collection.
The acetaminophen Raman spectrum in Figure 6 (red trace) is approximately 1,300 times weaker than the sodium bicarbonate spectrum collected under the same conditions. The strongest peak in the spectrum arises from the O2 vibration at 1,554 cm-1, which has the same intensity as in the bicarbonate and sucrose data. The intensity differences seen with acetaminophen sampled with PRIED vs. other Raman instruments likely arise from the difference in excitation wavelength. The 262-nm light is strongly absorbed by the aromatic moiety, which leads to changes in electron distribution and the molecular polarizability.
The lower-than-expected signal could occur from self-absorption of Raman shifted photons. A recent analysis by Hong and Asher suggests that self-absorption reduces the Raman intensity faster than resonance enhances it if an impurity is present that resonantly absorbs the Raman photons [12]. ADS measurements were performed on bulk reagent grade material, and it is unlikely that impurities contributed significantly to the spectrum. Photochemical degradation is also known to affect DUV Raman spectra of materials that have high DUV absorption. If the sample were photodegrading, one would expect to have seen decreasing signal over time while illuminating the same area of the sample. The same location of the sample was shot 10 times for 30 s each time in maximum detection mode, and no trend in the signal intensity was found. In addition, no sample discoloration, which is typical of photodegradation, was observed. Further addressing these observations is beyond the scope of this work, but this area will be the target of future research.
Algorithm Performance
Library entries for sucrose, acetaminophen, and baking soda were created using bulk materials at close range. These library elements were added to PRIED to explore algorithm performance. All shown instrument detection performance is based on live instrument results, not reprocessing of data after further analysis. Typical of field samples encountered by first responders, law enforcement and military personnel will be mixtures or visible residues on surfaces (sometimes called “high-trace” or “near-bulk”). In these cases, the algorithm will have to handle multiple components with Raman signals, fluorescent backgrounds, and discriminate materials of interest (threats) from nonthreats.
To demonstrate high-trace detection capability, data were collected from a several samples with a small amount (approximately 1 mg/cm2) of table sugar placed in the center of a ceramic tile without adhesive at 1-m standoff. A photograph of one such sample is shown in Figure 5a. Figure 5b shows representative Raman spectra of the sample at 2, 5, and 10 s of analysis time, all normalized to the height of the O2 peak for ease of intensity comparison. At 2 s, the presence of sugar is unmistakable to the unaided eye. Ten independent measurements were made of these samples, and the algorithm was instructed to identify the material at 2, 5, and 10 s. At 2 s, the algorithm correctly identified the material 90% of the time; at 5 and 10 s, sucrose was correctly identified in each measurement. An estimate of the signal-to-noise ratio (SNR) for the instrument can be instructive in understanding the overall performance. The SNR for these measurements increases from 13 to 19 to 25, with increasing measurement time. These SNR estimates are not fully reflective of detection performance, as a value of 13 suggests that a positive identification should have been made in every 2-s measurement. A full discussion on the relationship between the SNR and the detection performance is beyond the scope of this text but will be the subject of future research.
One behavior characteristic of most Raman systems points to an important fact that is often overlooked by typical end-users; after some amount of time for any instrument, there is no major benefit in continuing to measure. The detection performance reaches 100% or some other maximum value. Early generation hand-held systems, in our experience, will attempt to measure for several minutes to try and make an identification. However, this reduces the operational tempo and does not typically provide improved results. A newer commercially available Raman instrument with which we have experience times out after approximately 120 s.
PRIED was tested against two mixtures to identify “threat” components. Our initial testing was on a 10:1 mole fraction mixture of baking soda (NaHCO3) and calcium sulfate (CaSO4·2H2O). Both of these materials fluoresce visibly when excited at 262 nm and are encountered as narcotics fillers. Additionally, they are fine white powders that are not easily distinguished by eye when separate and cannot be readily separated when mixed. Figure 8a shows a representative spectrum of this mixture overlaying the two components. Both materials have clearly visible peaks in the mixture spectrum. Despite the strength of the baking soda signal, in all 20 measurements, PRIED identified both of the materials in 1 s. At 5-mole-percent CaSO4, additional measurement time is required to correctly identify the minor material.
Bengay® is a common topical pain reliever containing 30% methyl salicylate (MES), 10% menthol, and 4% camphor as active ingredients, along with nine inactive ingredients. This formulated product was expected to have a high fluorescence background and many features that would obscure the MES, a common chemical warfare agent simulant. However, the PRIED spectra of Bengay displayed minimal visible fluorescence (Figure 8b), and MES was correctly identified as in all of the 1-s measurements. Both the Bengay and baking soda/calcium sulfate tests indicate that even with present programming, PRIED could be helpful for determining threat materials in mixtures.
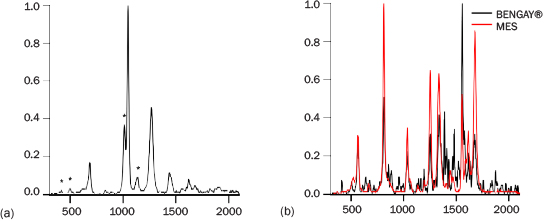
Figure 8: (a) Spectrum of 90:10 NaHCO3:CaSO4.2H2O; Sulfate Features Noted with *; (b) Spectrum of “BenGay®” Compared with MES.
Narcotics
Three reagent-grade narcotic samples were measured: cocaine hydrogen chloride (HCl), heroin HCl, and methamphetamine HCl. Figure 9 presents the spectra of a few milligrams of cocaine HCl and heroin HCl collected at 1 m with PRIED and with a 785-nm system. The tallest peaks with intensity 1 in the 262-nm spectra are from atmospheric oxygen. Cocaine HCl and heroin HCl have measurable spectra in less than 10 s with PRIED and have nearly no fluorescence background. The 785-nm instrument identified cocaine in 12 s and was unable to identify heroin. The heroin HCl spectrum is particularly weak due to rapid photodegradation of the material. A fresh sample exposed to the ADS Raman laser lost well-defined spectral features within 15 s of exposure; however, short integration times should present spectra with sufficient SNR to detect once a library element is constructed. Cocaine HCl matches well with the data from the 785-nm system, although many modes appear to be broader. This fact may arise from a combination of the instrument response function and UV absorption effects that are either thermal or electronic. ADS was unable to obtain any meaningful data on methamphetamine HCl due to high fluorescence. It is unknown currently if the observed high levels of fluorescence arose from contaminants in the sample, are a result of the rapid absorption of water by the material, or are intrinsic to methamphetamine exposed to DUV. The 785-nm system was able to identify methamphetamine after a 42-s analysis.
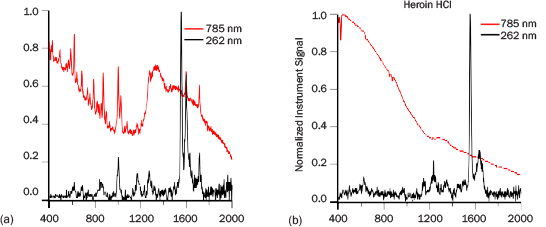
Figure 9: PRIED (1 m) and 785 nm Spectra of (a) Cocaine HCl and (b) Heroin HCl. All the Spectra Have Been Normalized to 1. The PRIED Spectra Were Collected in 30 s.
Identification of pure materials is a relatively simple task, but pure materials are rarely encountered in the real world. As discussed previously, excipients and fillers are commonly used in pharmaceutical and narcotics manufacture; some of these may be strongly fluorescent or have strong Raman features that obscure the active ingredients. Both of these cases may cause a rapid investigation to fail to identify illicit materials and require time-consuming laboratory analysis. We tested the PRIED hardware and algorithm to begin to understand how much signal is required to positively identify a material, particularly in a complex matrix.
CONCLUSIONS
The ADS results discussed herein (as well as third-party testing) suggest that the PRIED design can successfully identify suspect threat materials from distances of between 1 and 10 m. Accordingly, the PRIED is a promising man-portable piece of equipment that could enhance the operational capabilities of law enforcement, military, first responder, and forensic personnel in the identification and exploitation of clandestine explosives and narcotics laboratories at relatively safe distances.
Results show that common excipients used in combination with street drugs do not have strong fluorescence signals that overpower the DUV Raman spectra of narcotics or legal active pharmaceutical ingredients. Furthermore, if a material of interest is mixed with a highly fluorescent background or material with a complex spectrum, it can be identified within a few seconds from standoff distances. The existing algorithm is able to detect the materials discussed herein at high speed and with a low false alarm rate (FAR). Moreover, tt is clear that with additional development, the existing algorithm can be improved to do further mixture identification and possibly composition analysis. Finally, with minimal effort, the on-board PRIED library could incorporate a large suite of narcotics and related materials added for antinarcotics applications and forensic purposes.
Other improvements are also currently on the design table that will continue to refine and improve the user experience for PRIED. Future versions of the instrument will have reduced size, weight, and power consumption, as well as increased durability. And the unique capability of PRIED to provide rapid, standoff detection of narcotics can be expanded to other materials. In short, the ability to detect materials more quickly and/or at longer ranges than many current instruments offers significant advantages for field users for whom time is of the essence and safety is enhanced by distance.
Acknowledgments:
This material is based upon work supported by the Army Research Office (ARO) and the Department of Defense (DoD) under Contract No. W911NF-12-C-0086.
References:
- Fountain III, A. W., S. D. Christesen, R. P. Moon, J. A. Guicheteau, and E. D. Emmons. “Recent Advances and Remaining Challenges for the Spectroscopic Detection of Explosive Threats.” Applied Spectroscopy, vol. 68, no. 8, p. 795, 2014.
- Christesen, S. D., A. W. Fountain III, E. D. Emmons, and J. A. Guicheteau. “Raman Detection of Explosives.” Laser-Based Optical Detection of Explosives, edited by P. M. Pellegrino, E. L. Holthoff, M. E. Farrell, Boca Raton, FL: CRC Press, 2015.
- Tuschel, D. D., A. V. Mikhonin, B. E. Lemoff, and S. A. Asher. “Deep Ultraviolet Resonance Raman Excitation Enables Explosives Detection.” Applied Spectroscopy, vol. 64, no. 4, p. 425, 2010.
- Ostmark, H., M. Nordberg, and T. E. Carlsson. “Stand-Off Detection of Explosive Particles by Multispectral Imaging Raman Spectroscopy.” Applied Optics, vol. 50, no. 28, p. 5592, 2011.
- Mikhonin, A. V., S. V. Bykov, N. S. Myshakina, and S. A. Asher. “Peptide Secondary Structure Folding Reaction Coordinate: Correlation Between UV Raman Amide III Frequency, Psi Ramachandran Angle, and Hydrogen Bonding.” Journal of Physical Chemistry B, vol. 110, no. 4, p. 1928, 2006.
- Nagli, L., M. Gaft, Y. Fleger, and M. Rosenbluh. “Absolute Raman Cross-Sections of Some Explosives: Trend to UV.” Optical Materials, vol. 20, p. 1747, 2008.
- Emmons, E. D., J. A. Guicheteau, A. W. Fountain III, and S. D. Christesen. “Comparison of Visible and Near-Infrared Raman Cross-Sections of Exposives in Solution and in the Solid State.” Applied Spectroscopy, vol. 66, no. 6, p. 636, 2012.
- Hong, Z., and S. A. Asher. “Dependence of Raman and Resonance Raman Intensities on Sample Self-Absorption.” Applied Spectroscopy, vol. 69, no. 1, p. 75, 2015.


